
Matlab drawing
Powerful drawing function is one of the characteristics of Matlab. Matlab provides a series of drawing functions. Users don't need to think too much about the details of drawing. Only need to give some basic parameters to get the required graphics. High-level drawing function. In addition, Matlab provides low-level drawing operations that operate directly on the graphics handle. This type of operation treats each graphic element of the graphic (such as axes, curves, texts, etc.) as a separate object. The system assigns a handle to each object, which can be manipulated by the handle without affecting the other. section.
This chapter introduces the use of high-level drawing functions for drawing 2D and 3D graphics and other graphics control functions. Based on this, we introduce low-level drawing operations that can manipulate and control various graphic objects.
one. Two-dimensional drawingA two-dimensional graphic is a planar graphic that joins data points on a plane coordinate. Different coordinate systems can be used, such as Cartesian coordinates, logarithmic coordinates, polar coordinates, and so on. The drawing of two-dimensional graphics is the basis of other drawing operations.
one. Draw the basic function of a two-dimensional curveIn Matlab, the most basic and widely used plotting function is plot, which can be used to draw different curves on a two-dimensional plane.
1. Basic usage of the plot function
The plot function is used to draw a linear coordinate graph on a two-dimensional plane. To provide a set of x coordinates and corresponding y coordinates, a two-dimensional curve with x and y as the horizontal and vertical coordinates can be drawn. Application format of plot function
Plot(x,y) where x,y are vectors of the same length, storing the x and y coordinates.
Example 51 Draw a curve in the [0, 2pi] interval
The program is as follows: Enter the following command in the command window
>> x=0: pi/100: 2*pi;
>> y=2*exp(-0.5*x).*sin(2*pi*x);
>> plot(x,y)
After the program is executed, open a graphics window and draw the following curve in it.
Note: The point multiplication is used between the exponential function and the sine function because both are vectors.
Example 52 drawing a curve
This is the curve equation given in the form of parameters. As long as the parameter vector is given, the x, y vector is obtained separately to output the curve:
>> t=-pi:pi/100:pi;
>> x=t.*cos(3*t);
>> y=t.*sin(t).*sin(t);
>> plot(x,y)
After the program is executed, open a graphics window and draw the following curve in it.
The above mentioned arguments x, y of the plot function are vectors of the same length, which is the most common and basic usage. There are still some changes in the actual application. Explain separately:
1
2. a plot function with multiple input parameters
The plot function can contain several sets of vector pairs, each of which can draw a curve. The format of the plot function call with multiple input parameters is: plot(x1, y1, x2, y2, ..., xn, yn)
You can draw three curves in the same coordinate as the following commands.
>> x=linspace(0,2*pi,100);
>> plot(x,sin(x),x,2*sin(x),x,3*sin(x))
When the input parameters have a matrix form, the paired x, y draws a curve with the corresponding column elements as the abscissa and the ordinate, and the number of curves is equal to the number of columns of the matrix.
>> x=linspace(0,2*pi,100);
>> y1=sin(x);
>> y2=2*sin(x);
>> y3=3*sin(x);
>> x=[x;x;x]';
>> y=[y1;y2;y3]';
>> plot(x,y,x,cos(x))
x, y are all three-column matrices that make up the input parameter pairs and draw three curves; x and cos(x) form a pair and draw a cosine curve.
The plot function can be used to directly draw the data of the matrix in the graphical form. At this time, the plot function draws each column of the matrix as a curve in the form. Such as
>> A=pascal(5)
A =
1 1 1 1 1
1 2 3 4 5
1 3 6 10 15
1 4 10 20 35
1 5 15 35 70
>> plot(A)
3. Plot function with options
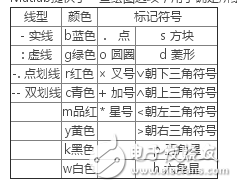
Matlab provides some drawing options for determining the line style, color, and data point markers for the curve being drawn. These options are shown in the table:
For example, draw curves and their envelopes in the same coordinates with different line types and colors.
>> x=(0:pi/100:2*pi)';
>> y1=2*exp(-0.5*x)*[1,-1];
>> y2=2*exp(-0.5*x).*sin(2*pi*x);
>> x1=(0:12)/2;
>> y3=2*exp(-0.5*x1).*sin(2*pi*x1);
>> plot(x,y1,'k:',x,y2,'b--',x1,y3,'rp');
In the plot function, three sets of drawing parameters are included. The first group draws two envelopes with a black dashed line, the second group draws a curve y with a blue double-dash line, and the third group is marked with a red five-pointed star discretely. data point.
4. Double ordinate function plotyy
The advantage of entertainment tablet lies in having a powerful chip and excellent hardware. If you want to play various online videos on the tablet and run various software smoothly, the performance of the hardware is an absolute prerequisite. In addition, a high-speed and stable WIFI module is also required, which must be compatible with multiple 802.11 B/G/N protocols at the same time, so that the webpage can be loaded instantly when the webpage is opened, and the online video can be played smoothly. So hardware is the premise and foundation, without good performance everything else is empty talk.
In addition to having a good CPU as a prerequisite, it is equally important to carry a professional video player. A professional video player must perform equally well both online and offline.
Entertainment Tablet,High capacity battery Tablet,WIFI Tablet
Jingjiang Gisen Technology Co.,Ltd , https://www.gisentech.com