
Lighting quality refers to whether the lighting source meets the criteria such as visual function, comfort, safety, and aesthetic appeal. Applying these quality indicators properly can give your lighting space a fresh perspective, particularly in the era of LED lighting, where the quality of light is crucial. Using these indicators when buying LED light sources can save you time and effort while delivering optimal results. Below, we'll explore the main indicators of lighting quality.
1. Color Temperature
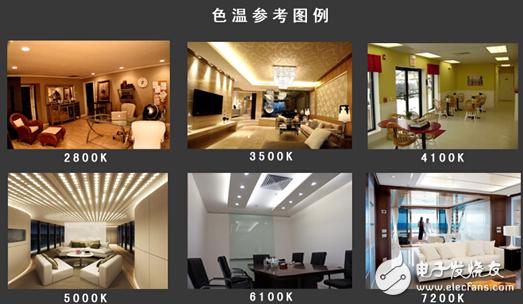
Color temperature describes the color of white light, varying between warmer hues (red tones) and cooler tones (blue tones). It's measured in Kelvin (K). For indoor lighting, the typical range is 2800K to 6500K. Sunlight is the most familiar example of white light, composed of multiple colors, with red, green, and blue being the most significant.
A prism can separate sunlight into its constituent colors, proving that white light is indeed a mix of multiple colors. White light’s color is often described using terms like warm white, natural white, daylight white, and cool white. However, for precise descriptions, color temperature is the preferred method.
While color temperature is typically understood through professional instruments, for a more intuitive grasp, here’s a visual guide:
2. Color Rendering
This refers to how well a light source reveals the true colors of objects. It's indicated by the color rendering index (Ra), which ranges from 0 to 100. Higher Ra values indicate better color rendering, meaning objects look more natural under the light.
Sunlight has the richest spectrum and thus the best color rendering. Artificial light sources generally fall short, but comparing them to sunlight helps assess their performance. Holding your hand up to the light and observing the palm color is a practical way to evaluate color rendering—natural skin tones suggest good performance.
For LED lights, Ra can be categorized into three levels: less than 69, 70–79, and over 80. High-quality indoor lighting should aim for Ra values above 80. Here’s a visual comparison:

In advanced assessments, referring to the Planckian locus in the CIE1931 chromaticity diagram offers a more nuanced evaluation.
3. Luminous Flux and Illuminance
Luminous flux measures the total amount of light emitted by a source, measured in lumens (lm). Illuminance, on the other hand, is the luminous flux per unit area, measured in lux (lx). Higher illuminance means brighter surfaces.
Illuminance depends on the distance between the light source and the illuminated object and the light distribution pattern of the fixture. Narrower beam angles produce higher illuminance, while wider angles reduce it. Proper illuminance levels are essential for health and comfort, and national standards offer guidelines.
4. Light Distribution Curve
The effectiveness of indoor lighting relies heavily on the layout of fixtures and their light distribution curves. Good lighting design combines efficient placement and proper light distribution.
Fixtures not only protect and enhance the light source but also redirect light output within specified angles. The light distribution curve illustrates how light spreads from a fixture. Smaller angles create brighter focal points.
Common distribution patterns include 15° or 30° for track spotlights, 30° or 60° for downlights, and 120° for bulbs and ceiling lights. Panel lights typically feature distributions between 60° and 90°.
5. Luminous Efficiency
This measures how efficiently a light source converts electrical power into light, expressed in lumens per watt (lm/W). LED sources boast efficiencies of 90–130 lm/W, compared to 48–80 lm/W for CFLs and just 9–12 lm/W for incandescents.
6. Luminaire Efficiency
When a light source is installed in a fixture, its overall output decreases. Luminaire efficiency compares the combined output to the source’s individual output. High efficiency indicates superior craftsmanship and energy-saving potential.
7. Glare
Glare occurs when excessive brightness from a light source causes visual discomfort. On roads at night, high-beam headlights illustrate glare. Indoors, poorly designed lighting can similarly cause discomfort and even temporary blindness. Children and the elderly are particularly vulnerable. Balancing brightness and distribution minimizes glare while maintaining visibility.
8. Flicker
Flicker happens when a light source’s brightness varies over time. Long exposure to flickering lights can lead to visual fatigue. The critical flicker fusion frequency is around 0.02 seconds, faster than the human eye’s retention time of 0.04 seconds.
Detecting flicker involves using a camera to capture light patterns. Bright and dark bands on the screen indicate flicker. Fewer or thinner bands mean lower flicker. Not all cameras reveal flicker, so testing with multiple devices is advised.
9. Safety
Lighting equipment safety covers electric shock risks, leakage hazards, overheating, explosions, and structural integrity. National standards regulate safety. High-priced products tend to be more reliable, while excessively cheap options warrant caution.
10. Energy Efficiency
Energy-efficient lighting reduces operational costs and environmental impact. Key factors include the luminous efficiency of the light source, the luminaire’s efficiency, and the thermal management of LED sources. High-efficiency drivers and effective cooling systems ensure longer-lasting, eco-friendly solutions.
By considering these ten indicators, you can make informed decisions about lighting quality and functionality.
Solar Carport System,Solar Carport Structural,Carport Solar Parking,Custom Car Parking Solar Carport Structural
Hebei Jinbiao Construction Materials Tech Corp., Ltd. , https://www.pvcarportsystem.com